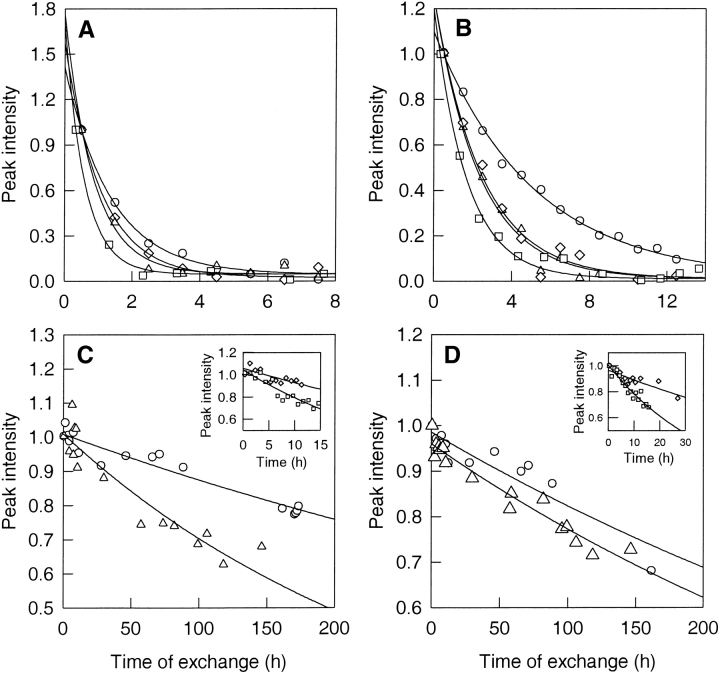
Figure 4.
Kinetics of HX. The proton-to-deuterium exchange kinetics of the backbone amide proton of Lys 36 (A) and Ala 46 (B), residues belonging to Class I, are shown at 0 (circles), 0.3 (triangles), 0.5 (diamonds), and 0.8 M (squares) GdmCl. The peak intensities were normalized with respect to the intensity in the first spectrum. The solid lines through the data are fits to Equation 1. (B) Kinetics of exchange of the amide protons of Leu 24 (C) and Leu 79 (D), residues belonging to Class II, are shown at 0 M (circles) and 0.3 M (triangles) GdmCl. The insets show the kinetics of exchange at 0.5 M (triangles) and 0.8 M (squares) GdmCl. The peak intensities were normalized with respect to the intensity in the first spectrum. The solid lines through the data are fits to Equation 1.

