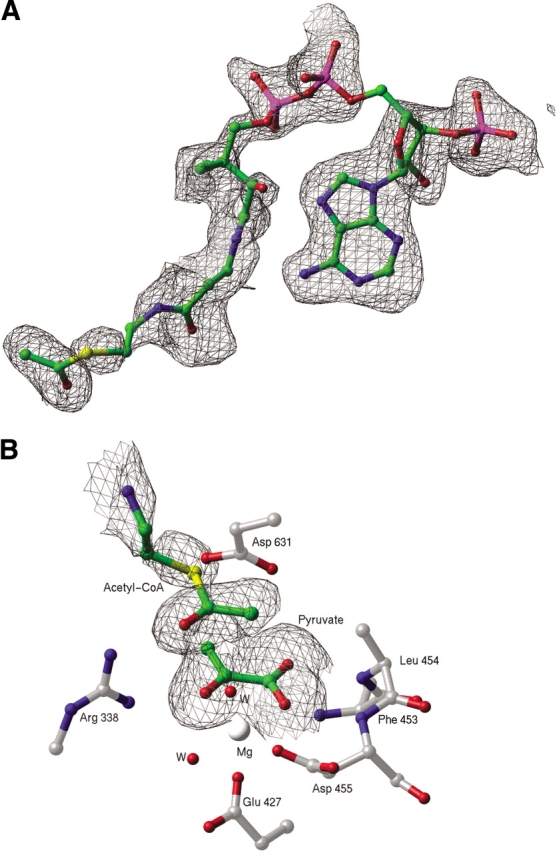
Figure 2.

(A) Portion of an Fo-Fc electron density omit map, contoured at 2 σ. The refined model of acetyl-coenzyme A (acetyl-CoA), which was omitted for the purpose of map calculation, is superimposed and shown as a ball-and-stick model. (B) Portion of an Fo-Fc electron density omit map, contoured at 2 σ, showing bound pyruvate and the acetyl group of acetyl-CoA.
