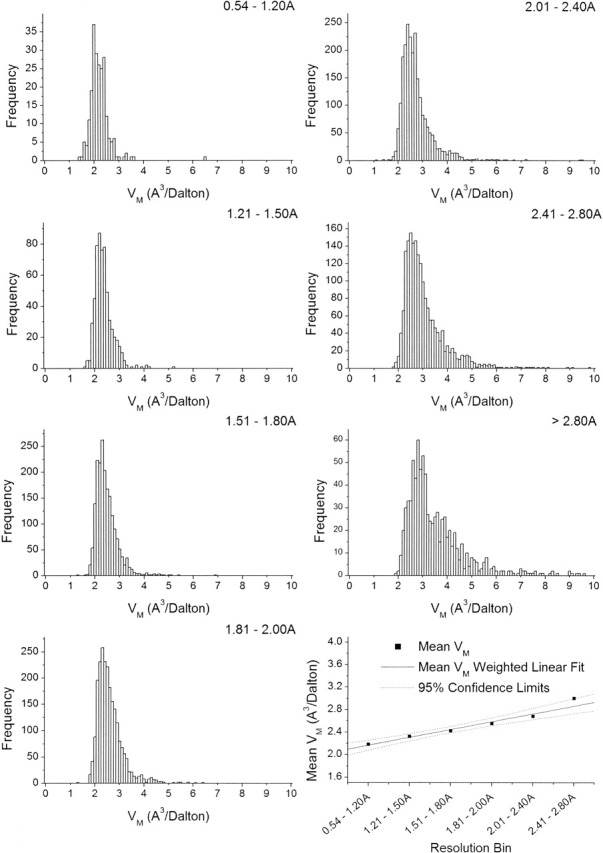
Figure 3.

Frequency distributions of VM for 10,471 crystal forms of proteins in discriminant resolution bins. It is evident that more tightly packed crystals (lower VM) tend to diffract to higher resolution. Graph at lower right shows mean for each frequency distribution, linear regression weighted by standard deviation, and confidence interval (95%). From the correlation (R2 = 0.97), confidence limits, and P-value (0.0009), the relationship between resolution and VM is statistically significant.
