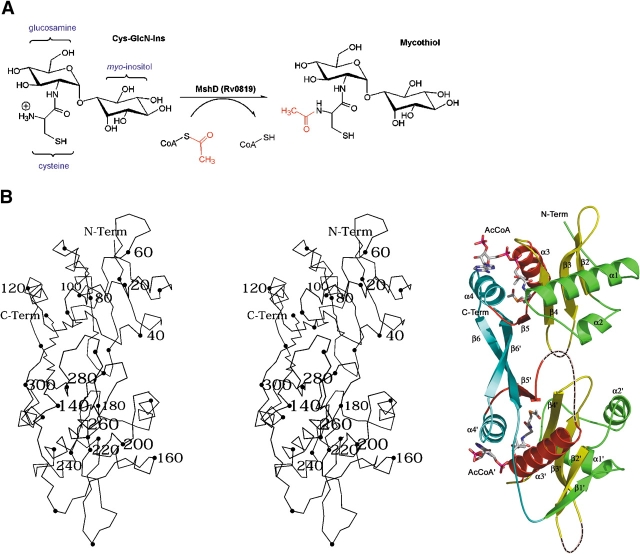
Figure 1.
Structural features of MshD. (A) Reaction catalyzed by MshD, the final step in the biosynthesis of mycothiol. (B) Stereo Cα diagram of MshD with ribbon diagram of the MshD binary acetyl–CoA complex. In the Cα diagram every 10th residue is marked by a black sphere, while every 20th residue is numbered. In the ribbon diagram, the conserved structural elements of the GNAT fold are colored according to Vetting et al. (2002). Dashed lines indicate structural elements with no electron density. Acetyl–CoA is modeled in a stick representation. Figures 1B and 2 ▶ ▶ were prepared with the programs PYMOL (DeLano 2002) and MOLSCRIPT (Kraulis 1991).

