
Figure 2.
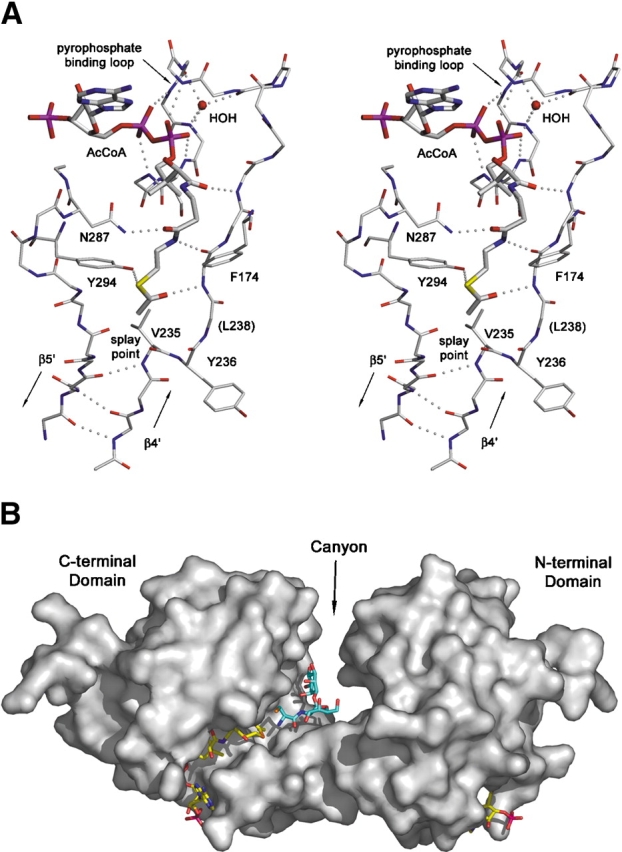
Interaction of MshD with substrates. (A) Stereodiagram of the acetyl–CoA (thick sticks) binding site in the C-terminal domain. (B) Solvent-accessible surface representation of MshD with experimentally determined acetyl–CoA (yellow carbons) and modeled Cys–GlcN–Ins (blue carbons). For visual clarity, four loops (residues 70–75, 176–179, 266–277, 226–230) that exhibit high mobility and overlay the sides of the canyon were removed prior to calculation of the surface.