
Figure 2.
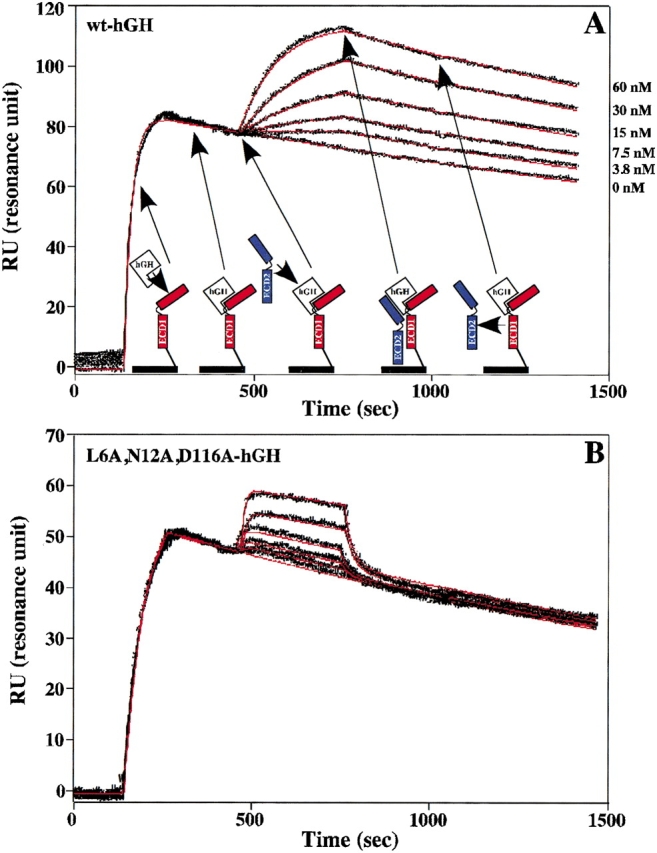
Trimolecular surface plasmon resonance (TM-SPR) to measure the binding kinetics of the hGHR ECD2 to the 1 : 1 intermediate complex of hGH–hGHR ECD1. (A) Sensorgrams showing the Site2 binding kinetics of wt-hGH to wt-hGHR ECD2. Also shown is a cartoon representation of TM-SPR method. The hGHR ECD1 (red) is coupled to the sensor chip through a disulfide bond at the C-terminal domain. This coupling allows for minimal lateral movement and proper orientation of ECD1. A saturating concentration of free hGH is injected over the sensor chip to form the 1 : 1 intermediate hGH–hGHR ECD1 complex. A second injection of free hGHR ECD2 (blue) is followed to determine the binding kinetics of the 1 : 2 ternary complex. Twofold dilution series with concentrations of 0, 3.75, 7.5, 15, 30, and 60 nM for the second hGHR ECD2 concentrations were typically used. This results in the case of the highest concentration of about one half of the potential sites bind a soluble ECD. The six sensorgrams were pooled and globally fit (red lines) to the decaying surface model (Joss et al. 1998) by using the program Clamp99 (Myszka and Morton 1998) to determine the on (kon) and off (koff) binding rate constants. (B) The fitted Site2 binding sensorgrams for the L6A,N12A,D116A-hGH triple mutant to the hGHR ECD2 (concentrations of 15.63, 31.25, 62.5, 125, and 250 nM were used).