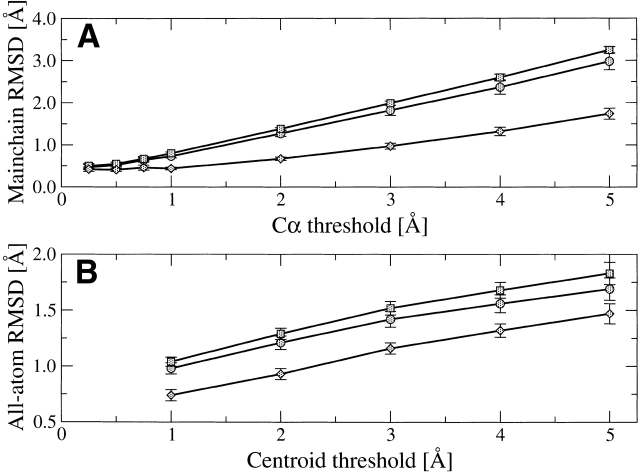
Figure 1.
Relationship between model accuracy and restraint specificity for (A) main chain only models generated under varying Cα restraints and (B) all-atom models generated under 1 Å Cα restraints and varying side chain centroid restraints. In both graphs, the average RMSD over all targets is shown for the closest model to the crystal structure (circles), the ensemble average RMSD (squares), (A) the main chain of the un-regularized mean model (diamonds), and (B) all atoms of the regularized mean model (diamonds). Error bars are drawn at one standard deviation from the mean.

