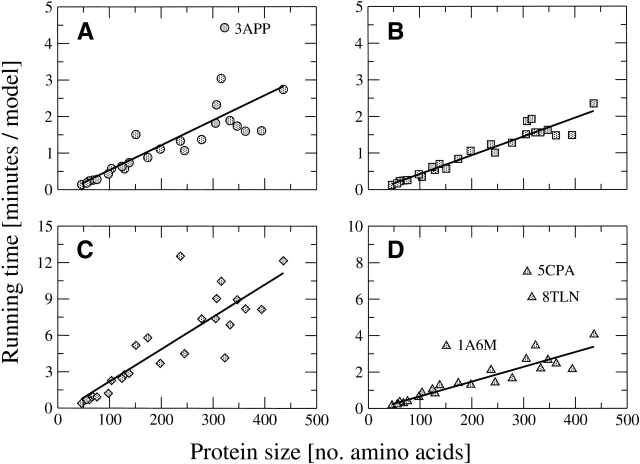
Figure 3.
Computational cost (average CPU time to generate one model, y-axis) as a function of protein size (number of amino acids, x-axis), for (A) main chain only modeling under 1 Å Cα restraints; (B) main chain only modeling under 1 Å Cα restraints but excluding the CPU cost of failed passes of the conformational search algorithm; (C) all-atom modeling under 1 Å Cα restraints and unrestrained side chains; and (D) all-atom modeling under 1 Å Cα and side chain centroid restraints. Linear regressions are plotted as thick lines, with correlation coefficients of (A) 0.80, (B) 0.96, (C) 0.86, and (D) 0.93 excluding the outliers 1A6M, 5CPA, and 8TLN.

