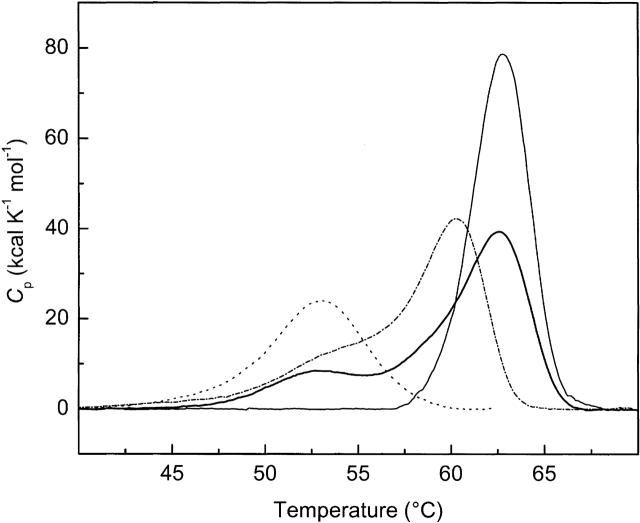
Figure 2.
DSC scans of EI(H189A) obtained in the presence of Buffer A with 2 mM Mg2+ and the following effectors: 5 mM pyruvate (dashed line); 5 mM pyruvate and 0.2 mM PEP (dashed dotted line), 5 mM pyruvate and 1 mM PEP (thick solid line), or 1 mM PEP (thin solid line). DSC data are shown after instrument baseline subtraction and normalization for protein concentration and scan rate. Each scan is additionally corrected for a protein linear baseline.

