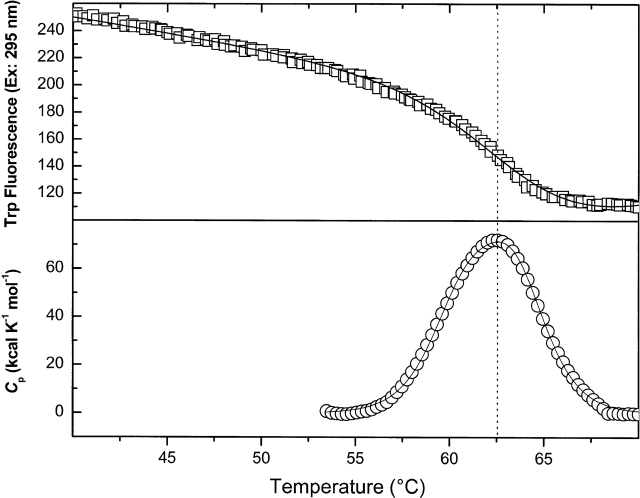
Figure 3.
Thermally induced changes in Trp residue exposure (open squares) and in excess heat capacity (open circles) of wild-type dephospho-EI in Buffer A, pH 7.5 in the presence of 0.65 mM phosphonopyruvate and 2 mM Mg2+ upon temperature increases from 20°C to 70°C. DSC data are shown after instrument baseline subtraction and normalization for protein concentration and scan rate (30°C/h), and subtraction of a protein sigmoidal baseline. The fit of Trp fluorescence data to a two-state model of unfolding is shown by a solid line. The fit of DSC data to a sequential model of two, two-state transitions is shown by a solid line. A dashed line is drawn through Tm of the Trp fluorescence transition and Tmax of DSC data.

