
Figure 5.
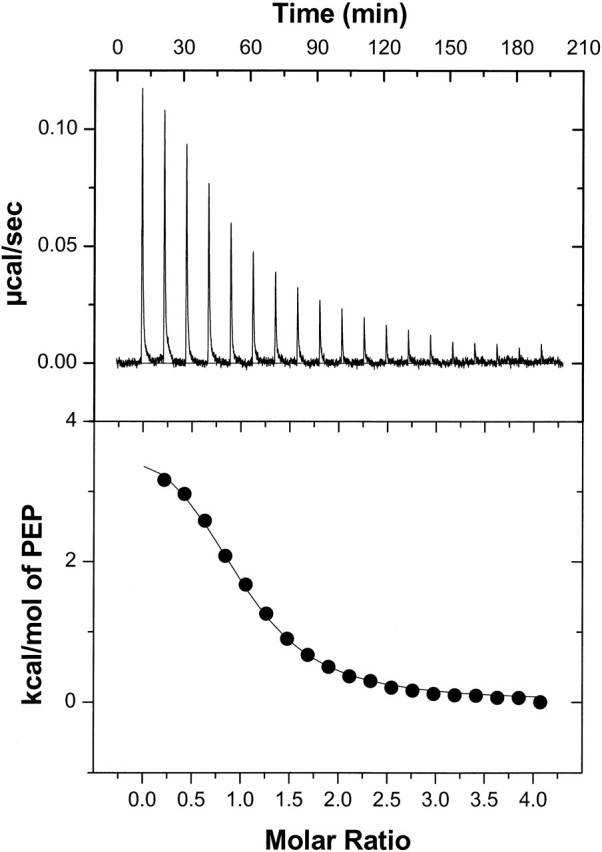
A representative titration of EI(H189A) with PEP in Buffer A + 2 mM Mg2+ at 20°C. The concentration of the protein in the cell is 5.16 μM subunit (0.33 mg/mL), and the PEP concentration in the syringe is 0.3 mM. (Upper panel) Observed heats for the 2nd through 20th injection of 5 μL PEP at 10-min intervals after baseline correction. Heats of dilution of PEP were obtained from injections 19–20 and subtracted from the data. (Lower panel) Corrected, normalized binding enthalpies versus the PEP/EI(H189A) molar ratio reflect the fact that heat is absorbed in this binding process. The data (filled circles) are fitted to a one-site binding model (thin solid line) which gives KA′ = 9.3 ± 1.1 × 10⁵ M−1, ΔH = 4.1 ± 0.2 kcal mole−1, and n = 0.97 ± 0.03 for the stoichiometry of PEP binding to EI(H189A) subunit.