
Figure 3.
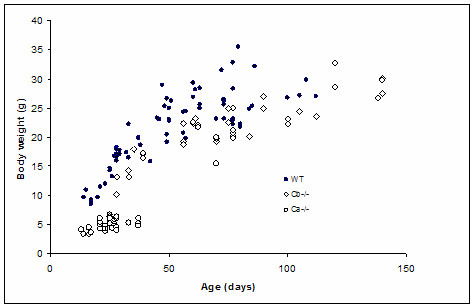
Postnatal growth of Cα and Cβ KO mice: the figure depicts the correlation between age and measured body weight of WT mice (n = 76) versus Cα KO (n = 32) and Cβ KO (n = 42) mice. Linear regression analysis showed that both Cα and Cβ KO mice have a significantly lower body weight when compared to WT mice (P < 0,0001) when adjusted for age.