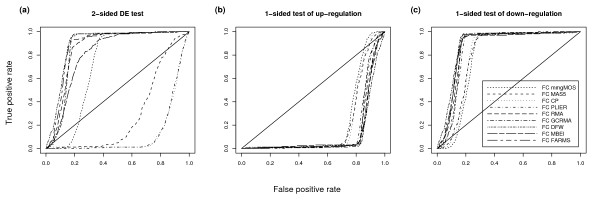
Figure 1.
Comparison of 1- and 2-sided tests of DE for very low FC genes. ROC charts of Golden Spike data using a 2-sided and two 1-sided tests of DE. For these charts all unchanging probesets are used as true negatives, genes with FC of 1.2 are used as true positives, and no post-summarization normalization is used. We only show results for the FC DE detection method. The different charts show a.) probesets selected using a 2-sided test of DE, b.) probesets selected using a 1-sided test of up-regulation and c.) probesets selected using a 1-sided test of down-regulation. The diagonal line shows the "line of no-discrimination". This shows how well we would expect random guessing of class labels to perform.

