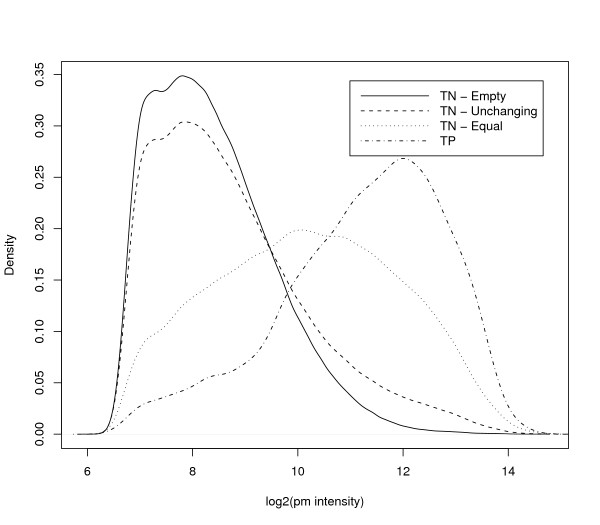
Figure 3.
Density plots of intensities for different choices of true negatives. These plots show the distributions of intensities of perfect match (PM) probes across all six arrays of the Golden Spike data, for different subsets of probesets. We show plots for three potential choices of true negative (TN) probesets: the Empty probesets are defined as those for which there is no corresponding spike-in RNAs. The Equal probesets are defined as those spiked in at equal concentrations in the C and S conditions. The Unchanging probesets are defined as the set of all Empty and Equal probesets. For this chart we have defined true positives (TP) as those probesets which have been spiked in at higher concentration in the S condition relative to the C condition.

