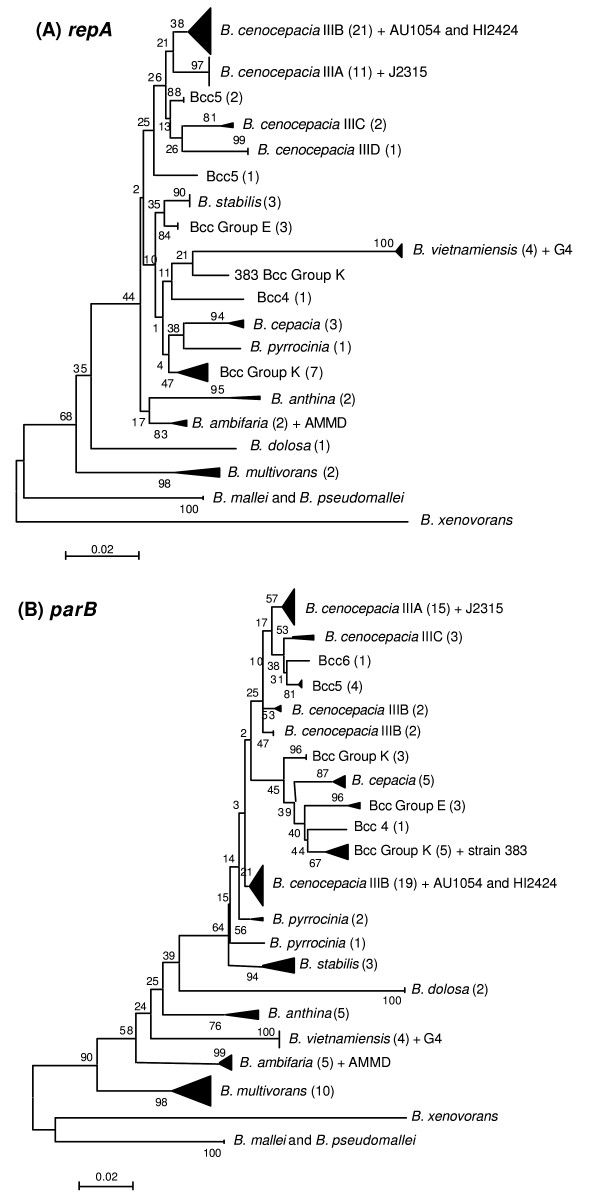
Figure 2.
Diversity of B. cepacia complex repA and parB genes. Phylogenetic trees of repA (Panel A) and parB (panel B) genes determined from the Bcc isolates examined in this study were drawn as described in the methods. The number of STs examined for each distinct phylogenetic group is provided in brackets, followed by names of genomic reference strains where they were included in the analysis. The genetic distance scale is indicated. The B. mallei, B. pseudomallei and B. xenovorans repA or parB genes, respectively, were included as outgroups for each tree.

