
Figure 1.
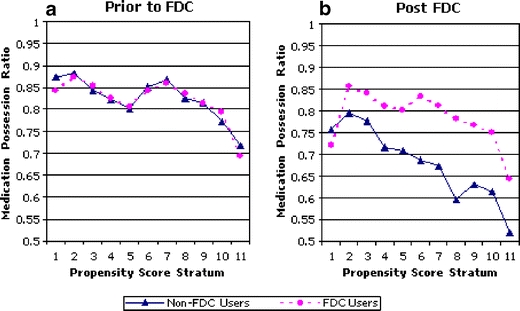
Medication possession ratio by propensity score stratum, before and after the availability of the fixed dose combination product. Legend: The risk stratum denotes the likelihood a patient will switch to the FDC. The line marked by circles illustrates the MPR for patients who switched to the FDC. The line marked by triangles illustrates the MPR for patients who did not switch to the FDC (FDC Fixed dose combination, MPR: medical possession ratio). a MPR by stratum before the FDC was available. b MPR by stratum after the FDC was available.