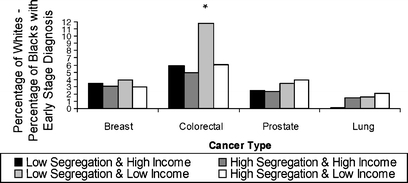
Figure 1.

Disparity in early-stage diagnosis by area category for black versus white individuals. Asterisk, P value comparing white–black difference in early-stage diagnosis for the low-segregation and low-income area to: low-segregation and high-income area (P = .03), high-segregation and high-income area (P = .004), and high-segregation and low-income area (P = .001).
