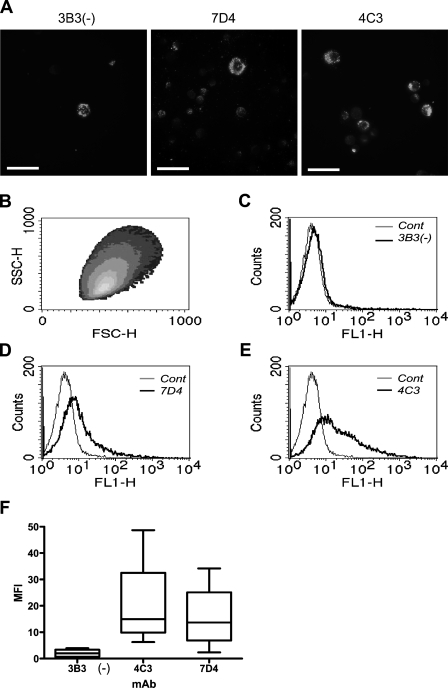
Figure 6.
Isolation and flow cytometric analysis of surface-isolated chondrocytes. (A) Suspensions of chondrocytes from the superficial zone IHC labeled with MAbs 3B3(−), 7D4, and 4C3. Bar = 25 μm. (B) Density scatter plot of gated population. (C–E) Histograms showing labeling of cells for each antibody. (F) Box and whiskers plot of immunoreactivity (mean fluorescence intensity) to each antibody (n=4). Box shows the 25% and 75% percentile and median (horizontal line) values. Bars show upper and lower extremes.

