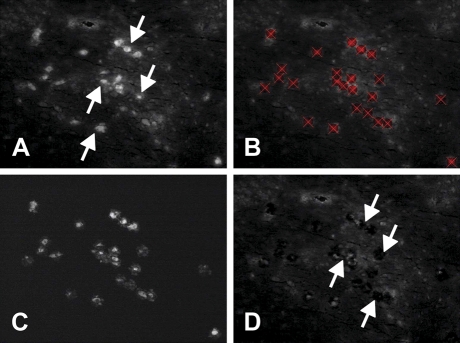
Figure 4.
Laser capture microdissection (LCM) method. (A) Coronal section through NTS showing fluorescence (white), indicating the presence of TH immunoreactivity (white arrows identify several TH cells). (B) TH-positive cells (red X) targeted for laser capture. (C) Tissue that has been removed from the slide and collected onto a plastic cap. This material is homogenized, and RNA is isolated for RT-PCR. (D) White arrows indicate examples of holes left in the tissue section after the cells seen in A–C were removed by the laser.

