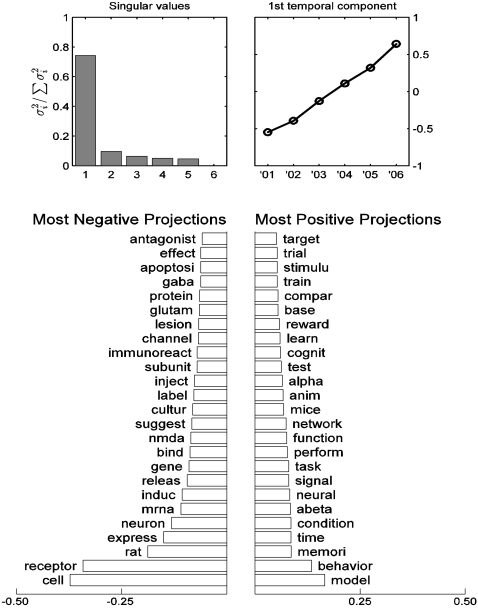
Figure 11. Word-frequency dynamics.
Top left: distribution of singular values. The first component accounts for 74.4% of variance. Top right: The first right singular vector (temporal component). Bottom: The most negative and most positive projections of specific words onto the first component. Most positive words are increasing in frequency; most negative words are decreasing.

