
Figure 2. Migration Rates and Population Divergence Times among Near East Populations.
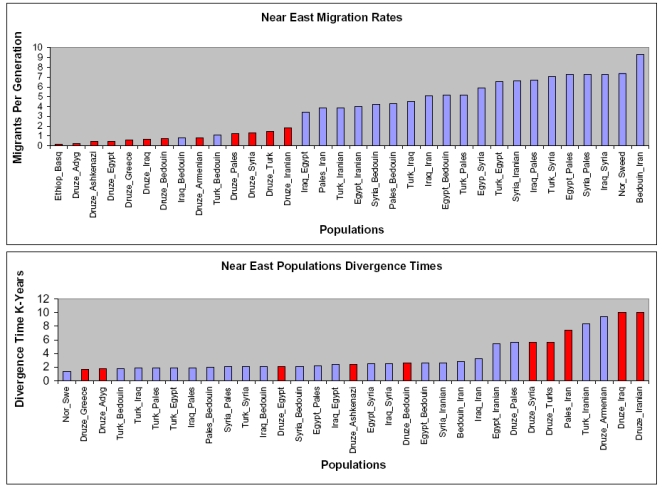
Demographic modeling using the IM application[40] applied to mtDNA HVS-I sequences (nucleotides 16067–16384) from various Near East populations. Red bars = Druze with other Near East populations. Purple bars = Near East populations among themselves. Migration rates represent the mode of the posterior distribution of the number of migrants per generation. The divergence time is in thousand of years. The following populations were used: 311 Druze from the current study. Sequences reported in Macaulay et al [7]: Egyptians (Egypt) 67 samples; Iraqis (Iraq) 116 samples; Syrians (Syria) 69 samples; Palestinians (Pales) 110 samples; Turks (Turk) 218 samples; Armenians (Armenian) 191 samples; Adygei (Adyg) 50 samples; Greeks (Greece) 65 samples; Swedes (Swe) 32 samples; Nowegians (Nor) 231 samples; Basques (Basq) 156 samples. Sequences reported by Hammer et.al [53]: Bedouins (Bedouin) 58 samples. Sequences reported by Metspalu et.al [54]: Iranian (Iran) 436 samples. Sequences reported by Thomas et.al [55]:Ashkenazi Jews (Ashkenazi) 78 samples Ethiopians (Ethiop) 74 samples.