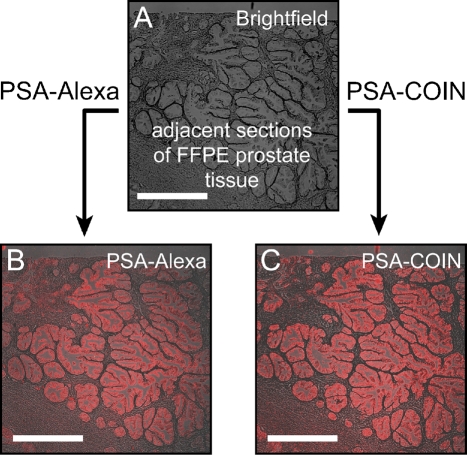
Figure 1.
Comparison of filter cube images of anti-PSA–COIN and anti-PSA–Alexa on adjacent sections of formalin-fixed paraffin-embedded (FFPE) prostate tissue. Images are acquired using conventional filter set imaging (×5 objective, Calcium Crimson filter set, exposure 5 sec). (A) Brightfield image of a prostate tissue section. (B) Fluorescence emission from anti-PSA–Alexa 568 on FFPE prostate tissue. (C) Raman emission from anti-PSA–COIN for the same region as B in the adjacent slide. Both stains report PSA expression in the epithelium of prostate glands but not in the stroma, and the COIN and Alexa show comparable brightness (true intensities shown). Bar = 500 μm.

