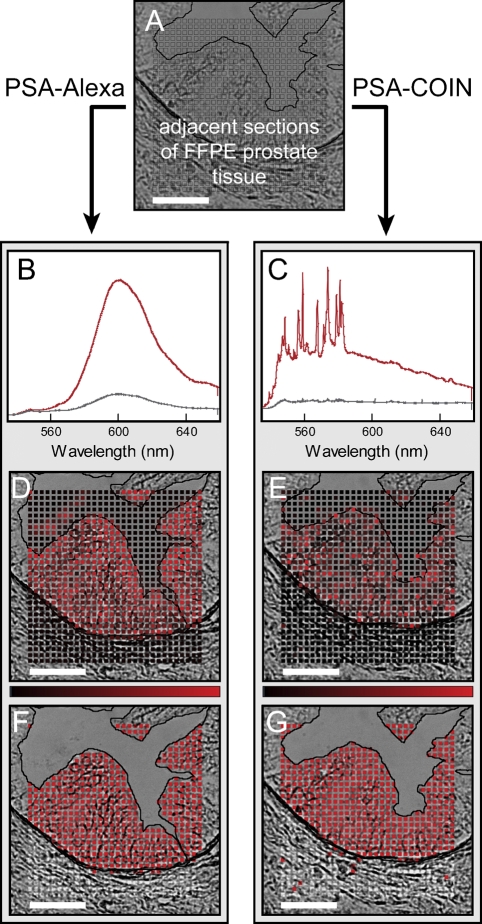
Figure 2.
Illustration of spectral analysis for COIN and Alexa stains on adjacent tissue sections. (A) Adjacent sections of FFPE prostate tissue were stained either with anti-PSA–COIN or with anti-PSA–Alexa. Spectra were acquired at each point (boxes) in a raster pattern spanning the stroma, epithelium, and lumen of a single gland. (B) Representative spectra from anti-PSA–Alexa Fluor 568 measured in the epithelium (red) and stroma (gray). The upper spectrum (red) was also used as the reference spectrum for subsequent Alexa spectral fitting. Nonspecific Alexa staining (gray spectrum) occurred uniformly across the stroma at ∼20% of positive signal. (C) Representative spectra from anti-PSA–COIN measured in the epithelium (red) and stroma (gray). The upper spectrum (red) was also used as the reference spectrum for subsequent COIN spectral fitting. (D,E) Intensities use a linear scale from black (zero) to red, as shown by the intensity bar; some high-intensity values are truncated. (F,G) Binary results for Alexa and COIN where each pixel is classified as positive (red) or negative (gray). The lumen region is rejected from the binary analysis due to the difficulty of accurately identifying this boundary in brightfield images as well as the occasional presence of stained debris in the lumen. Note the presence of stained tissue debris in D. Bar = 50 μm.

