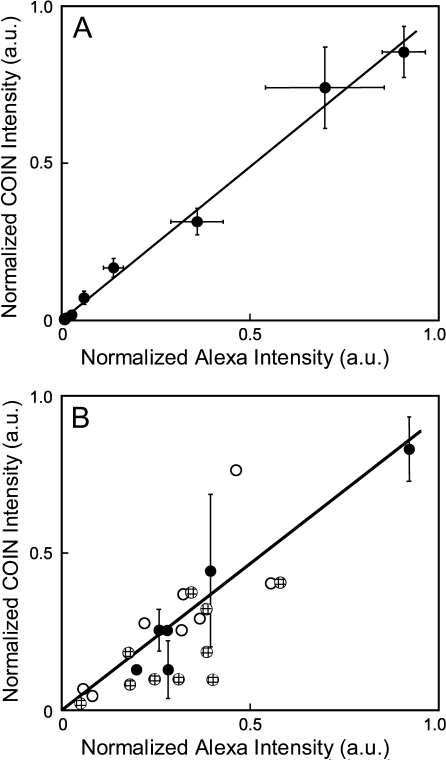
Figure 3.
Direct quantitative comparison between anti-PSA–Alexa and anti-PSA–COIN in parallel plate assays and tissue assays. (A) Direct comparison of intensities reported by anti-PSA–Alexa and anti-PSA–COIN for parallel wells in a plate-binding assay. Each data point is the average of three experiments conducted using the same COIN and Alexa reagents on different days, with corresponding error bars. Pearson correlation coefficient for the entire set is 0.996. (B) Direct comparison of intensities reported by anti-PSA–Alexa or anti-PSA–COIN from the same glands in adjacent tissue sections. COIN intensities are normalized by the intensity of the corresponding direct binding assay for each COIN preparation. COIN and Alexa intensities are reported as the signal-to-background ratio for each gland. Data include experiments performed the same day on adjacent slides (black circles), experiments using the same COIN on different days (black circles and cross-hatched circles), and experiments using completely different COIN preparations (black circles and white circles). Black symbols represent measurements using three different COIN preparations applied to adjacent slides and measured on the same day, and error bars represent the precision of replicate measurements. Pearson correlation coefficient for the entire set is 0.85.

