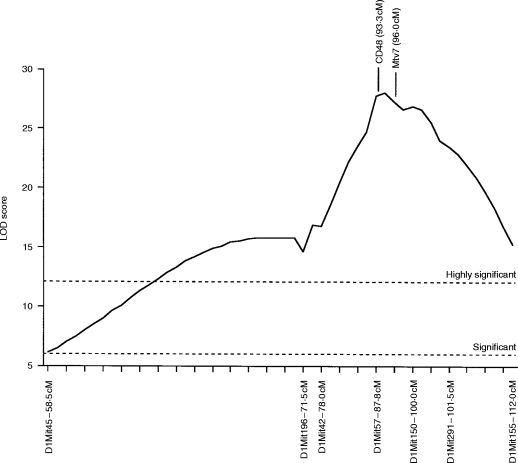
Figure 4.
Likelihood plot obtained for Chromosome 1 using the Map Manager QT linkage analysis program.19 Significance levels were calculated using the permutation test method of Churchill & Doerge,18 as implemented in the Map Manager QT linkage analysis software.19 This method indicated that, for the data set used, LOD scores greater than 6·0 are significant at the P = 0·05 level (indicated as ‘Significant’), while LOD scores greater than 12·1 are significant at the P = 0·001 level (indicated as ‘Highly Significant’). cM values represent distance from the centromere as given in the Mouse Genome Database.23

