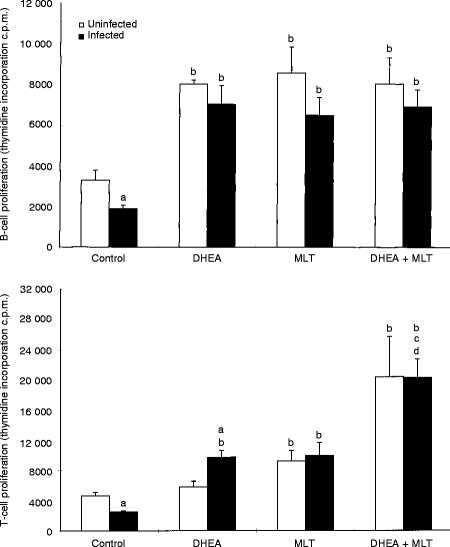
Figure 1.
Effects of DHEA, MLT and DHEA+MLT on LPS-stimulated B-cell- and Con A-stimulated T-cell proliferation of splenocytes. Every sample from each mouse was measured in triplicate. The bars are the mean±SE for eight mice. Letters indicate significant differences at P < 0·05. (a) Compared with uninfected mice receiving the same treatment; (b) compared with their respective untreated controls; (c) compared with their respective DHEA-treated mice; (d) compared with their respective MLT-treated mice.

