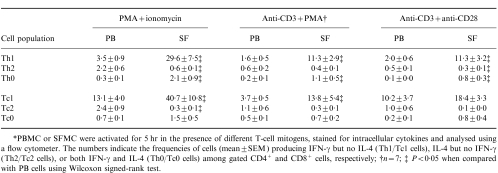
Table 2.
The percentages of different helper T cell (Th) and cytotoxic T cell (Tc) populations in PB and SF samples from eight patients with RA*
*PBMC or SFMC were activated for 5 hr in the presence of different T-cell mitogens, stained for intracellular cytokines and analysed using a flow cytometer. The numbers indicate the frequencies of cells (mean±SEM) producing IFN-γ but no IL-4 (Th1/Tc1 cells), IL-4 but no IFN-γ (Th2/Tc2 cells), or both IFN-γ and IL-4 (Th0/Tc0 cells) among gated CD4+ and CD8+ cells, respectively; †n =7; ‡P < 0·05 when compared with PB cells using Wilcoxon signed-rank test.

