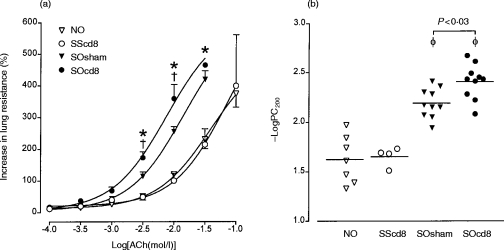
Figure 2.
(a) Mean percentage increase in lung resistance to increasing concentrations of acetylcholine (ACh) for four different groups of rats, described in the legend to Figure 1 (NO, SScd8, Sosham and SOcd8). The concentration–response curves are significantly shifted left for groups SOsham and SOcd8 by comparison with group NO. There was no effect of anti-CD8 antibody on non-sensitized ovalbumin (OA)-exposed animals, but the antibody further increased bronchial responsiveness of sensitized, allergen-exposed rats. *P < 0·05 for groups SOsham or SOcd8 compared with groups NO and SScd8; †P < 0·03 for SOsham compared with group SOcd8. (b) Mean −logPC200, which is the negative logarithm of the provocative concentration of ACh needed to increase baseline lung resistance by 200%, for the four groups of rats detailed in Figure 1. Anti-CD8 antibody treatment significantly enhanced allergen-induced increase in −logPC200 (P < 0·03). φP < 0·005 compared with groups NO and SScd8. Data are shown as mean±SEM.

