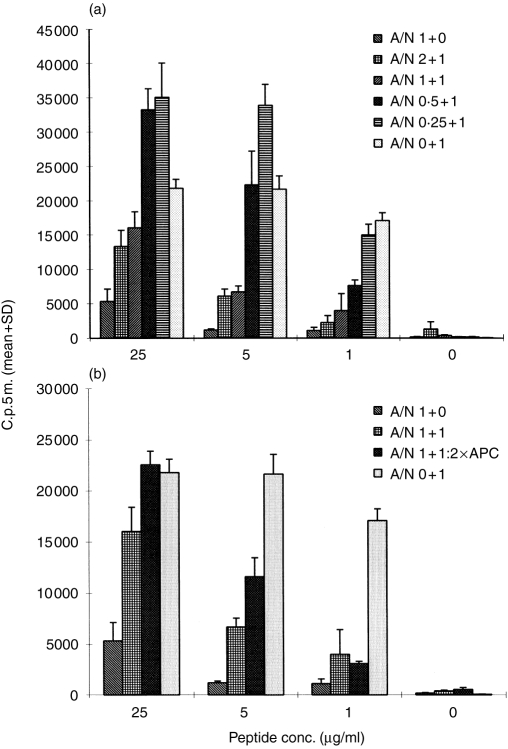
Figure 6.
Anergic H.243 T cells suppress the response of non-anergic H.243 T cells. (a) Immobilized TCR 76 or control mAb ZP 7A were incubated overnight with H.243 T cells. Then, both T-cell populations were used in a proliferation assay with increasing concentrations of peptide (or PHA) and APC using 2×10⁴ T cells per well. In addition, variable amounts of anergic cells (incubated with TCR 76) were mixed with 2×10⁴ non-anergic cells (incubated with ZP 7A), and a proliferation assay was performed. A/N: ratio of anergic cells versus non-anergic cells; 1–2×10⁴ cells. Proliferation was assessed by [3H]thymidine incorporation. Each value represents the mean counts per 5 min of triplicate cultures+SD. (b) Equal amounts (2×10⁴ cells) of anergic and non-anergic cells were mixed and proliferation was assessed in a proliferation assay using 1×10⁵ and 2×10⁵ irradiated APC per well.

