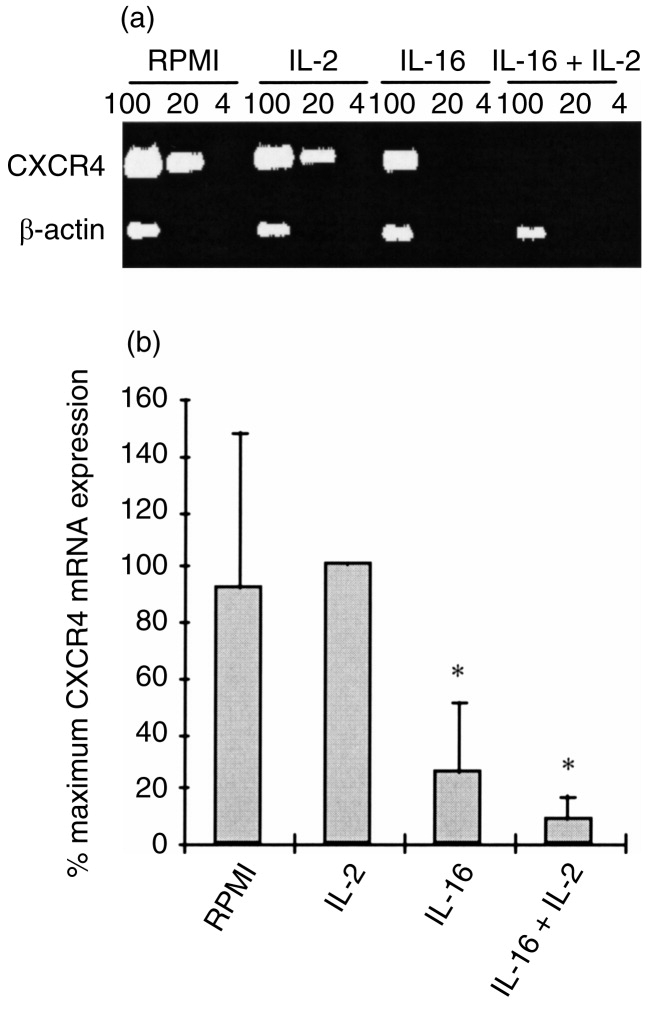
Figure 5.

Regulation of CXCR4 mRNA expression in MDM following 2 hr stimulation with IL-2, IL-16 or a combination of the two cytokines. (a) Representative results of RT-PCR analysis on RNA samples (100, 20 and 4 ng) from MDM of a single donor using specific primers for CXCR4 and for β-actin. (b) Relative CXCR4 mRNA expression in non-treated and cytokine-treated MDM represented as means with SE bars of percentage maximum gene expression from five different donors. P < 0·05 versus non-treated controls.
