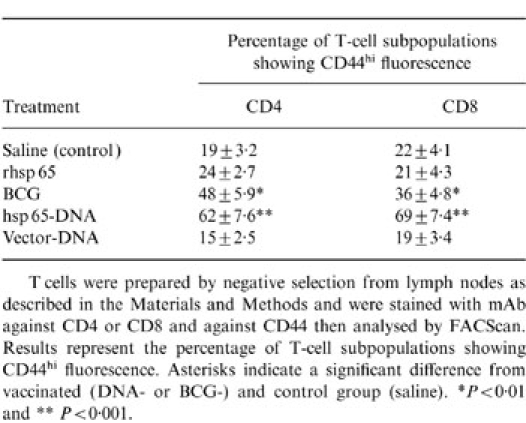
Table 2.
Expression of CD44 on CD4+CD8− and CD8+CD4− lymph node T cells freshly purified from hsp 65-DNA-immunized or BCG-vaccinated mice, or from control mice

T cells were prepared by negative selection from lymph nodes as described in the Materials and Methods and were stained with mAb against CD4 or CD8 and against CD44 then analysed y FACScan. Results represent the percentage of T-cell subpopulations showing CD44hi fluorescence. Asterisks indicate a significant difference from vaccinated (DNA- or BCG-) and control group (saline). *P < 0·01 and **P < 0·001.
