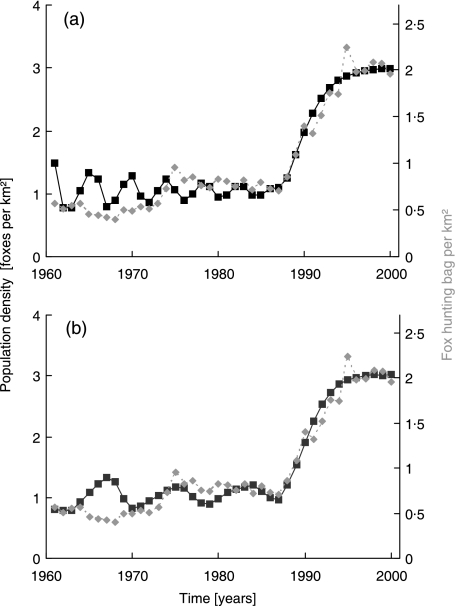
Fig. 2.
Hunting bag of Germany compared with fox population densities of (a) the population model (Anderson et al. 1981) (K = 3, Kt = 1) and (b) the simulation model. Hunting bag data (grey line) are given relative to hunted area (Bellebaum 2003). The figures show population (left, model) and hunting density (right, data) with epidemic rabies and after successful eradication. Vaccination in the models started in 1988. For reference scaling, the disease-free situation was used, i.e. a spring density of 3 foxes km−2 corresponds to 2 hunted foxes throughout the year. The population reduction by the disease as well as the rate of recovery after the onset of vaccination resulted independently from both modelling approaches.

