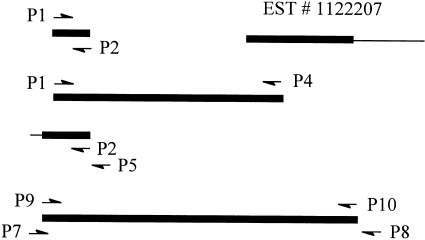
Figure 1.
Schematic representation of overlapping mouse CD97 cDNA clones. Coding regions are shown as black horizontal bars and non-coding regions as thin lines. The position and direction of PCR primers used are indicated by arrows. The 5′-ends of the cDNAs are to the left and the 3′-ends are to the right.

