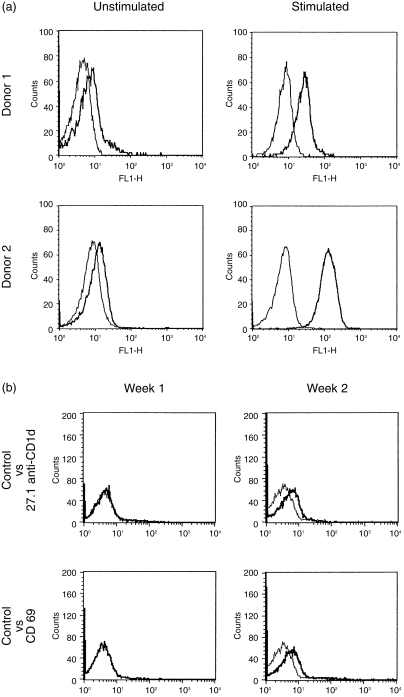
Figure 4.
CD1d expression by activated T cells. (a) Freshly isolated peripheral blood mononuclear cells (PBMC) from two donors were cultured for 24 hr with or without stimulation and then analysed by indirect immunofluorescence with 42.1 anti-CD1d monoclonal antibody (mAb) (42.1) (thick lines) or isotype-matched control Ab (thin lines). Similar results were obtained with the other anti-CD1d mAbs and the rabbit anti-CD1d Ab (not shown). The very weak staining in the cells cultured without stimulation was not seen in the freshly isolated resting T cells (results not shown). (b) Freshly isolated peripheral blood mononuclear cells isolated 1 week apart from the same donor were analysed by indirect immunofluorescence with the indicated specific mAbs (thick lines) versus control antibodies (thin lines). FL1-H, FITC channel.

