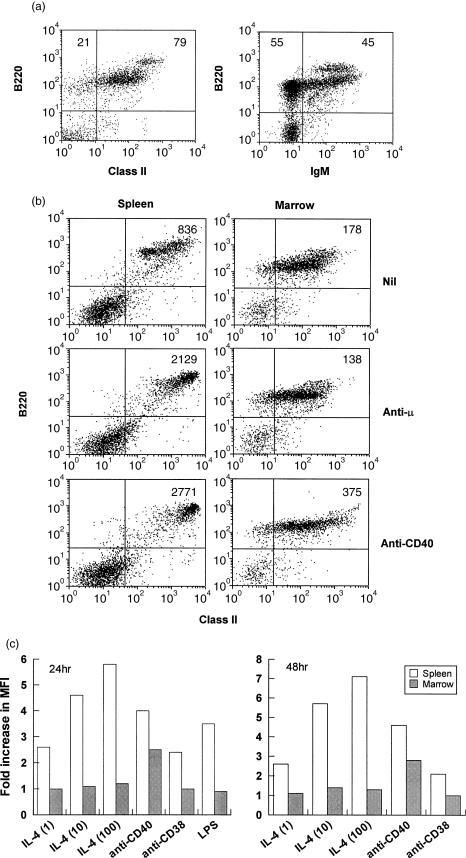
Figure 2.
Bone marrow B cells fail to up-regulate MHC class II in response to BCR ligation but are responsive to CD40 ligation. (a) Bone marrow cells were stained to reveal expression of MHC class II and IgM on B220+ cells. Figures in the upper quadrants show the percentage of B220+ cells bearing MHC class II (left panel) and IgM (right panel). (b) Spleen and bone marrow cells were cultured at 2×10⁶/ml in medium or with 10 µg/ml F(ab)2 anti-µ or 5 µg/ml anti-CD40 as shown. After 24 hr the cells were stained for B220 and MHC class II expression and analysed by flow cytometry. Gating was as for Fig. 1. The results shown represent 5000 gated events, and the figures in the upper right quadrant indicate the MFI of class II staining of the various populations. (c) Spleen and bone marrow cells were cultured as above with the indicated stimuli for 24 or 48 hr before being analysed for MHC class II expression. IL-4 was used at 1, 10 and 100 U/ml, anti-CD40 at 5 µg/ml, anti-CD38 at 20 µg/ml and LPS at 10 µg/ml. The results shown indicate the fold increase in the mean fluorescence of MHC class II on B220+ cells compared to that of control, unstimulated cells. The control values were: spleen (24 hr) 355; bone marrow (24 hr) 150; spleen (48 hr) 376; bone marrow (48 hr) 205. The data shown were calculated from analysis of 10 000 gated events in each case.

