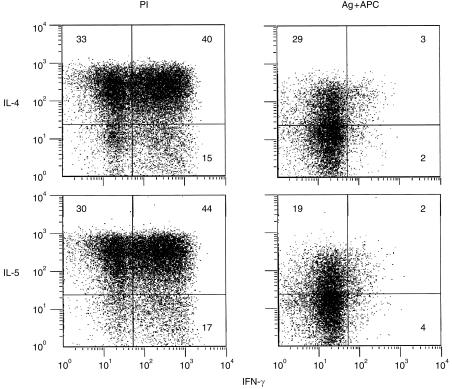
Figure 2.
Co‐expression of IFN‐γ and IL‐4 or IFN‐γ and IL‐5 varies with activation stimulus and demonstrates functional heterogeneity of cloned cells. AC1.1 T cells were treated as described for Table 1. Dot plots show coexpression of IFN‐γ and IL‐4 or IFN‐γ and IL‐5 after stimulation for 4 hr with PI or with antigen (Ag; 5 µg/ml) and APC. Numbers in quadrants indicate percentage of total lymphocyte‐gated cells.

