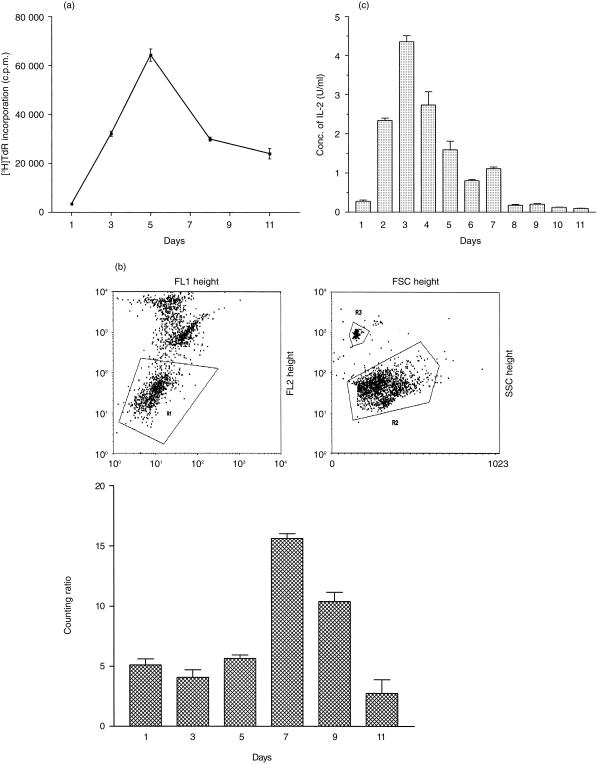
Figure 1.
Kinetic examination of the MLR system. (a) Lymphocyte proliferation during MLR for 11 days at an original stimulator:responder cell ratio of 2:1. Proliferation was determined each day by measurement of [3H]thymidine incorporation; the results are shown as the mean c.p.m. ± SEM (n = 3). (b) Cell counts during a MLR. Dead cells were excluded from this analysis by propidium iodide exclusion (R1). Relative cell counts were expressed as a cell (R2):bead (R3) ratio. Each point represents the mean of three replicate determinations; the error bars show the SEM. (c) Representative results showing the production of IL-2 at daily time points during MLR as determined by a CTLL-2 bioassay. Each point represents the mean of three replicate determinations; the error bars show the SEM.

