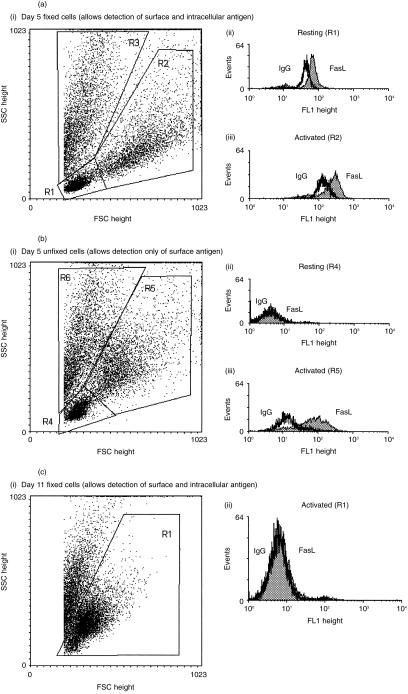
Figure 5.
(a) Representative flow cytometric profiles showing the expression of total FasL (both surface and intracellular) in lymphocytes harvested from MLR at day 5. (I) Dot plot showing gated populations in the paraformaldehyde-fixed MLR sample. (II) Histogram showing total FasL in resting lymphocytes. (III) Histogram showing total FasL in activated lymphocytes. (Note: when comparing this with Fig. 5b, cell fixation can cause alterations in light scatter properties and an apparent reduction in surface FasL staining.) (b) Representative flow cytometric profiles showing the expression of FasL on the surface of lymphocytes harvested from an MLR at day 5. (I) Dot plot showing the gated populations from an unfixed MLR sample. (II) Histogram showing the expression of FasL on the surface of resting lymphocytes. (III) Histogram showing the expression of FasL on the surface of activated lymphocytes. (c) Representative flow cytometric profiles showing the expression of total FasL on lymphocytes harvested from a MLR at day 11. (I) Dot plot showing the gated populations from a paraformaldehyde-fixed MLR sample. (II) Histogram showing the expression of FasL by activated lymphocytes.

