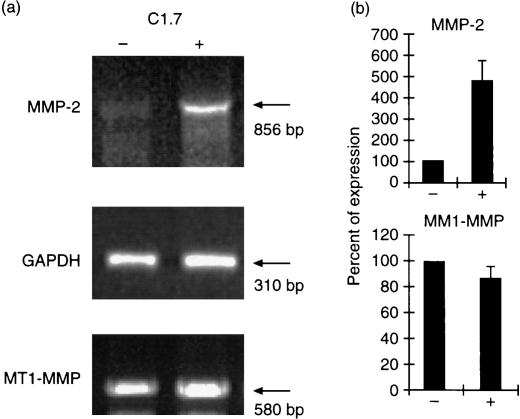
Figure 5.
Induction of MMP‐2 expression by h2B4 stimulation. Total RNA was prepared from control (–) and C1.7 stimulated (+) YT cells. RT‐PCR was performed using primers described in Table 1. (a) Semiquantitative RT–PCR of MMP‐2 and MT1‐MMP. PCR for MMP‐2, MT1‐MMP, and GAPDH were done at 36, 35, and 20 cycles of PCR amplification, respectively, which were determined as in linear range of amplification for each gene. Each PCR was a representative of three separate PCR reactions. (b) Quantitation of PCR products. After electrophoresis, the ethidium bromide‐stained gel was scanned and densitometric analysis was performed using AlphaImager 2000 (Alpha Innotech Corp., San Leandro, CA). The MMP‐2 or MT1‐MMP PCR values were normalized to the average of GAPDH PCR value and expressed as percentage of expression. PCR value of control sample (–) was set to 100%. Each bar represents the average of triplicate determinations (± SD).

