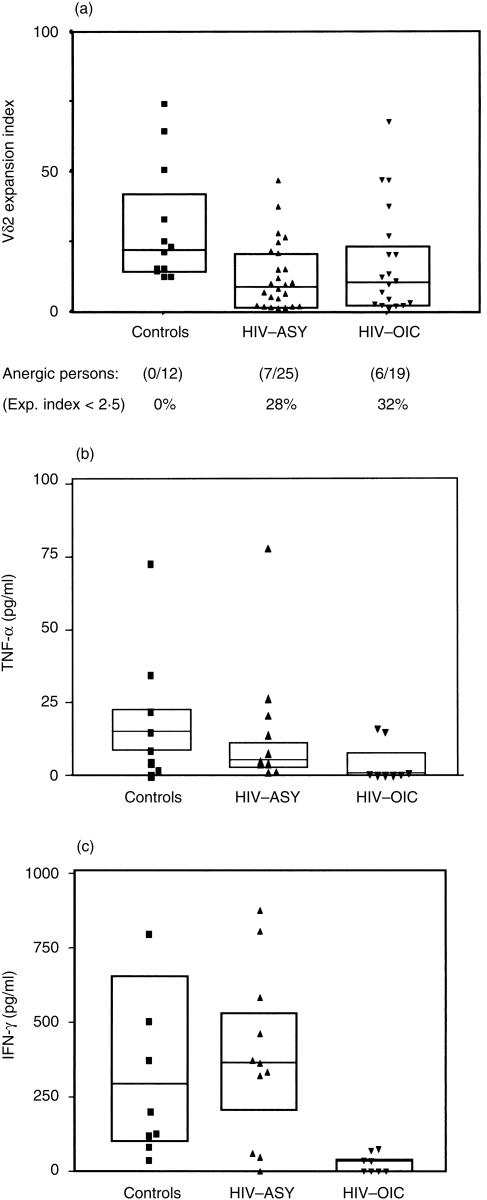
Figure 2.
γδ T-cell anergy to non-peptidic microbial antigens in human immunodeficiency virus (HIV)-infected persons. (a) In vitro isopentenyl pyrophosphate (IPP)-driven expansion indexes obtained by cytometric analysis of peripheral blood mononuclear cell (PBMC) Vγ9Vδ2 T-cell cultures are shown for controls (n = 12) and HIV-infected persons (n = 44): asymptomatic subjects infected with HIV (HIV-ASY) n = 25; HIV-infected patients with opportunistic infections/co-infections (HIV-OIC) n = 19. Lines represent group medians, and boxes represent interquartile ranges. Data represents Kruskal–Wallis H-test results with Bonferroni correction: χ2 = 9·223, d.f. = 2, P = 0·05 (NS); for each group, the percentage of anergic (expansion index < 2·5) subjects is reported. The 24-hr IPP-driven tumour necrosis factor-α (TNF-α) production levels are shown in (b) and 24-hr IPP-driven interferon-γ (IFN-γ) levels in (c) for controls (n = 8) and HIV-infected persons (n = 19: HIV-ASY, n = 11; HIV-OIC, n = 8). Lines represent group medians, and boxes represent interquartile ranges. Data represents Kruskal–Wallis H-test results with Bonferroni correction: TNF-α (pg/ml): χ2 = 9·262, d.f. = 2, P = 0·05 (ns); IFN-γ (pg/ml): χ2 = 16·315, d.f. = 2, P = 0·005. EI, expansion index.

