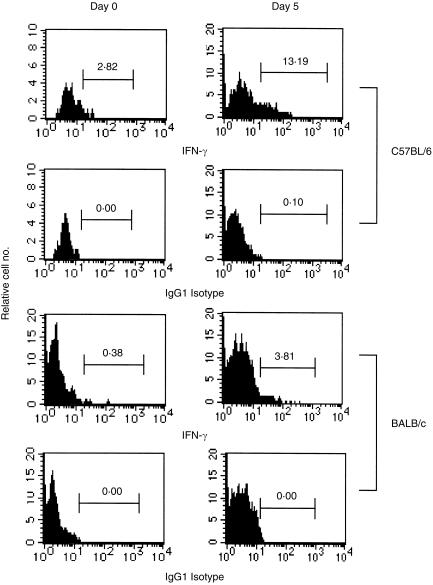
Figure 6.
PEC intracellular IFN-γ+ DN TCRαβ+ T-cell frequencies induced by MCMV infection. C57BL/6 and BALB/c mice were infected intraperitoneally with 1 × 10⁵ and 4 × 10³ PFU, respectively. Their peritoneal non-adherent cells (1 × 10⁶/ml) were incubated for 4 hr at 37° with PMA (10 ng/ml) and calcium ionophore (500 ng/ml) in the presence of Brefeldin A (10 mg/ml). Cells were stained with mAbs as described in the Materials and Methods. The histogram profiles show the percentages of the IFN-γ+ DN TCRαβ+ T cells of the DN TCRαβ+ T-cell-gated populations. The figure represents the data of one mouse out of three or four mice per group at each time-point in one of the three independent experiments.

