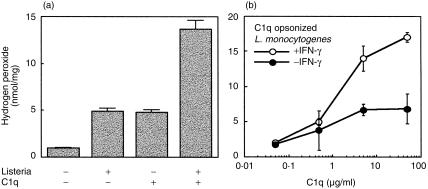
Figure 3.
Enhancement of H2O2 production by C1q-opsonized L. monocytogenes phagocytosis as well as by C1q adsorbed onto the wells. (a) H2O2 production was quantified in IC-21 cells. Approximately 3 × 10⁵ cells/well were incubated for 60 min with different stimuli: C1q adsorbed onto the plate wells (5 µg/ml) and/or L. monocytogenes (1 × 10⁶). (b) Enhancement of H2O2 production in response to L. monocytogenes opsonized with increasing amounts of C1q in the presence or not of IFN-γ (100 U/ml). Results are expressed as the mean ± SD nmol of H2O2 produced per mg of protein of eight determinations.

