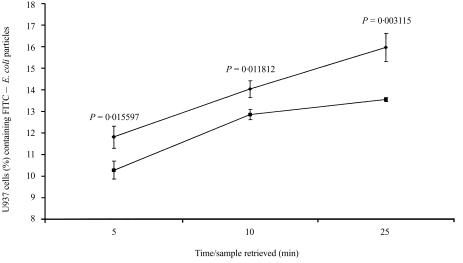
Figure 5.
Uptake of Escherichia coli K-12 by U937 cells. U937 cells were washed and resuspended to a density of 1 × 10⁶/ml in RPMI-1640 containing 1% (w/v) bovine serum albumin (BSA) and 20 mm HEPES (pH 7·4). One millilitre of the cell suspension was transferred to each of three tubes that were subsequently incubated for 1 hr at 4° with the F(ab′)2 fragments of non-immune or anti-FBG rabbit IgG or an equivalent volume of phosphate-buffered saline (PBS). The cells were then warmed to 37° and mixed with fluorescein isothiocyanate (FITC)-conjugated E. coli K-12 particles in a cell : particle ratio of 1 : 50. The samples were incubated at 37° and samples were removed from the tubes at 5, 10 and 25 min. Extracellular E. coli particles were quenched with equal volumes of Trypan blue and the cells were analysed by flow cytometry to determine the percentage of U937 cells that had ingested the FITC-labelled E. coli K-12 particles. The values at each time-point represent the mean of three independent experiments with the indicated standard deviation. •, U937 cells preincubated with the F(ab′)2 fragment of non-immune rabbit immunoglobulin G (IgG); ▪, U937 cells preblocked with the anti-FBG antibody. The P-values were obtained by two-tailed t-test and are indicated for each time-point.

