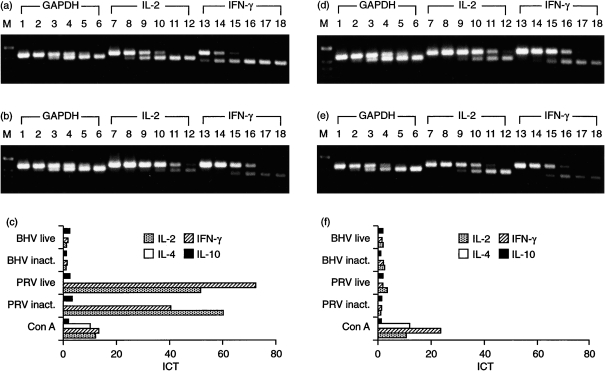
Figure 5.
Comparative cytokine profiles of peripheral blood mononuclear cells (PBMC) from immune and naive pigs. PBMC were stimulated in vitro with inactivated (inact.) or live pseudorabies virus (PRV), bovine herpesvirus 1 (BHV-1), concanavalin A (Con A) or left unstimulated for 24 hr. Results of quantitative, competitive reverse transcription–polymerase chain reaction (RT–qcPCR) are shown for one immune animal (pig 5) (a), (b) and (c) and one naive animal (pig 2) (d) and (e). The RT–qcPCR products obtained from PRV-stimulated (a and d) and non-stimulated (b and e) PBMC were separated in a 2% agarose gel; PCR was performed in the presence of 102−10−3 amol glyceraldehyde-3-phosphate dehydrogenase (GAPDH) MIMIC (lanes 1–6, upper DNA bands), 101−10−4 amol IL-2 MIMIC (lanes 7–12, upper DNA bands) or interferon-γ (IFN-γ) MIMIC (lanes 13–18, upper DNA bands), respectively. Calculation of the induction coefficients of transcription (ICT), as described in the Materials and methods, is shown in (c) and (f), which demonstrates that T helper 1 (Th1)-type cytokines are specifically induced by PRV only after restimulation of PBMC from the immune pig (a), (b) and (c), which surpassed the ICT found after 24 hr of stimulation with Con A. M, molecular-weight markers.

