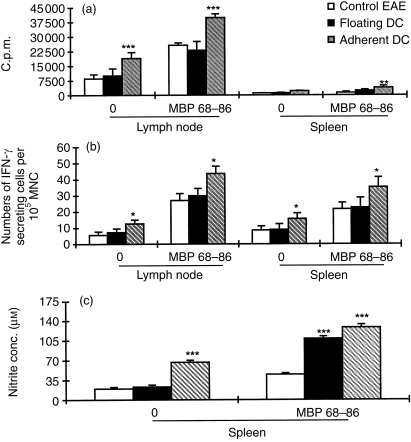
Figure 4.
Proliferative response (a), IFN-γ secretion (b) and NO production (c) of lymph node and spleen MNC from rats treated with adherent DC, floating DC or rats receiving PBS (control EAE) on day 14 p.i. with encephalitogenic MBP 68–86 and CFA (n = 4). These data (mean ± SD) represent one of two to three independent experiments with essentially identical results; *P < 0·05; **P < 0·01; ***P < 0·001.

