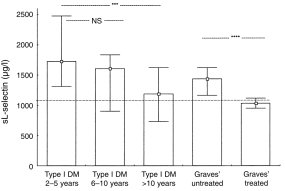
Figure 3.

Comparison of sL-selectin levels (median, interquartile range) in the peripheral blood of type I diabetic subjects (> 2 years. from diagnosis) in association with the disease duration and in patients with untreated (n = 14) and methamizole treated (n = 15) Graves’ disease. The dotted line represents mean+ 2SD of the sL-selectin levels in healthy controls. ***P < 0·005,****P < 0·0001.
