
Figure 1.
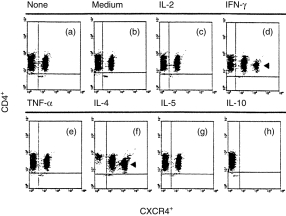
Double colour flow cytometric analysis of the distribution and modulation of CXC chemokine receptor 4 (CXCR4) on CD4+ T lymphocytes. The cells were either freshly isolated (a) or were stimulated for 24 hr with cytokine-free medium (b), interleukin (IL)-2 (c), interferon-γ (IFN-γ) (d), tumour necrosis factor-α (TNF-α) (e), IL-4 (f), IL-5 (g), or IL-10 (h), respectively. The percentages of CXCR4+ cells are indicated in the Results. The arrows indicate the bright fraction of CXCR4+ cells. The data were taken from a single experiment, which was representative of six similar experiments performed.