
Figure 4.
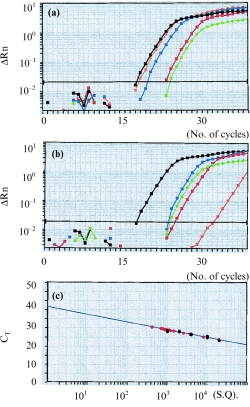
The plots of the real time detection and amplification of mRNA of CXC chemokine receptor 4 (CXCR4) in unstimulated, and in interleukin (IL)-4- and IL-10-stimulated, CD4+ T lymphocytes at different time intervals. (a) Green plots represent the amplification of mRNA of CXCR4 in unstimulated CD4+ T lymphocytes; blue, orange and red plots represent the amplification of mRNA of IL-4-stimulated CD4+ T lymphocytes at 4 hr, 16 hr and 24 hr, respectively; black plots represent the amplification of standard DNA template (2·0 × 104 copies) with a housekeeping gene (β-actin). CT values (representing the polymerase chain reaction cycle at which an increase in reporter fluorescence signal above baseline was first detected) were 18·1 for standard DNA template; 24·7 for CXCR4 mRNA in unstimulated CD4+ T lymphocytes; 22·8 for CXCR4 mRNA in IL-4-stimulated CD4+ T lymphocytes at 4 hr; 18·6 for 16 hr; and 22·8 for 24 hr, respectively. (b) Green plots represent the amplification of CXCR4 mRNA in unstimulated CD4+ T lymphocytes; blue, orange and red plots represent the amplification of mRNA of IL-10-stimulated CD4+ T lymphocytes at 4 hr, 16 hr and 24 hr, respectively; black plots represent the amplification of standard DNA template (2·0 × 104 copies) with a housekeeping gene (β-actin). CT values were 24·2 for CXCR4 mRNA in IL-10-stimulated CD4+ T lymphocytes at 4 hr; 34·9 for 16 hr; and 24·7 for 24 hr, respectively. (c) Demonstration of the linear relationship between CT and log starting quantity (S. Q.) of standard DNA template (black circles) or target (CXCR4) mRNA (red circles). The plots shown are representative of two similar experiments conducted.