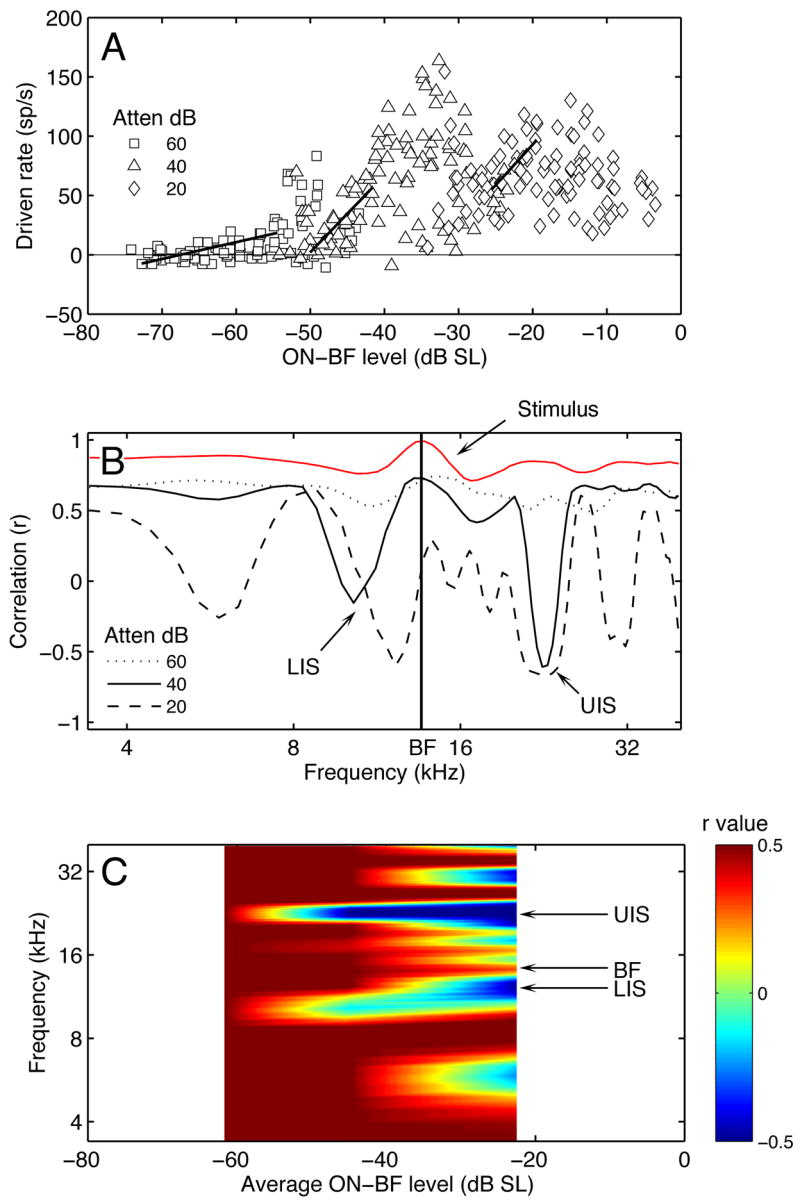
Figure 4.

Spectral integration properties of the representative type III neuron (same unit from Figure 3). A. Rate-level functions showing the region of maximum linear correlation between ON-BF level and response magnitude (line segments). B. Maximum linear correlations (r) for rate-level functions derived at frequencies surrounding BF. Negative r values reveal lower and upper inhibitory sidebands (LIS, UIS). Stimulus-bound correlations between BF and OFF-BF components are indicated in red. C. Correlation map showing r in relation to frequencies in B and the average ON-BF levels in A.
