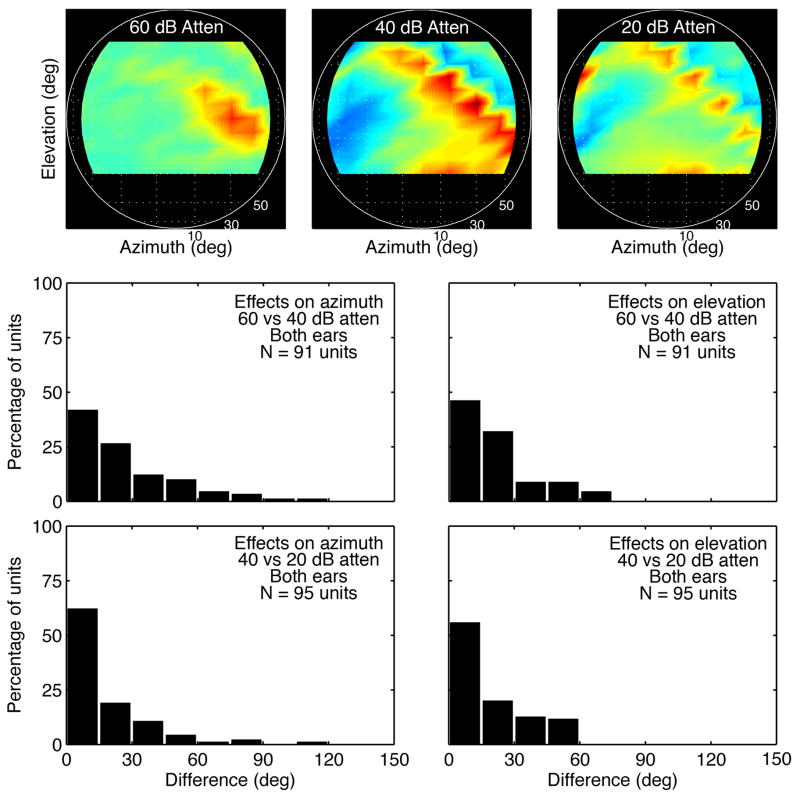
Figure 8.
Effects of level on spatial tuning. Surface plots (upper panels) show the directional rates of the representative unit at three presentation levels. Histograms (lower panels) describe the difference in the azimuth and elevation of maximum directional rates at two sound levels for a population of IC neurons (lower panels).

